
Understanding Loss vs Epochs Graph: A Complete Guide (2026)
Discover how to analyze a loss vs epochs graph to optimize model training, identify overfitting, and implement early stopping effectively.

Understanding Loss vs Epochs Graph: A Complete Guide (2026)
Training a language model is an intricate process that involves constant monitoring and tweaking to achieve optimal performance. One of the most commonly used metrics for this purpose is the loss vs epochs graph. This graph provides invaluable insights into the training process, helping you decide when to stop training, assess model performance, and identify issues like overfitting or underfitting.
In this guide, we will dive deep into how to analyze a loss vs epochs graph, interpret its curves, and make informed decisions based on its patterns. By the end of this tutorial, you will have a comprehensive understanding of how to leverage these graphs to improve your model's efficiency and effectiveness.
Prerequisites
- Basic understanding of machine learning and neural networks
- Familiarity with Python and libraries like TensorFlow or PyTorch
- Ability to plot graphs using Matplotlib or similar tools
Step 1: Plotting the Loss vs Epochs Graph
Before we can analyze a loss vs epochs graph, we need to generate one. This graph plots the loss value on the y-axis and the number of epochs on the x-axis. Here's a simple example using TensorFlow:
import matplotlib.pyplot as plt
# Sample data for demonstration purposes
epochs = range(1, 21)
train_loss = [0.9, 0.8, 0.7, 0.65, 0.6, 0.55, 0.53, 0.52, 0.51, 0.5,
0.49, 0.48, 0.47, 0.46, 0.45, 0.44, 0.43, 0.42, 0.41, 0.4]
val_loss = [0.95, 0.85, 0.8, 0.75, 0.7, 0.68, 0.67, 0.66, 0.65, 0.64,
0.63, 0.62, 0.61, 0.6, 0.6, 0.59, 0.58, 0.57, 0.56, 0.55]
plt.plot(epochs, train_loss, 'b', label='Training loss')
plt.plot(epochs, val_loss, 'r', label='Validation loss')
plt.title('Training and Validation Loss')
plt.xlabel('Epochs')
plt.ylabel('Loss')
plt.legend()
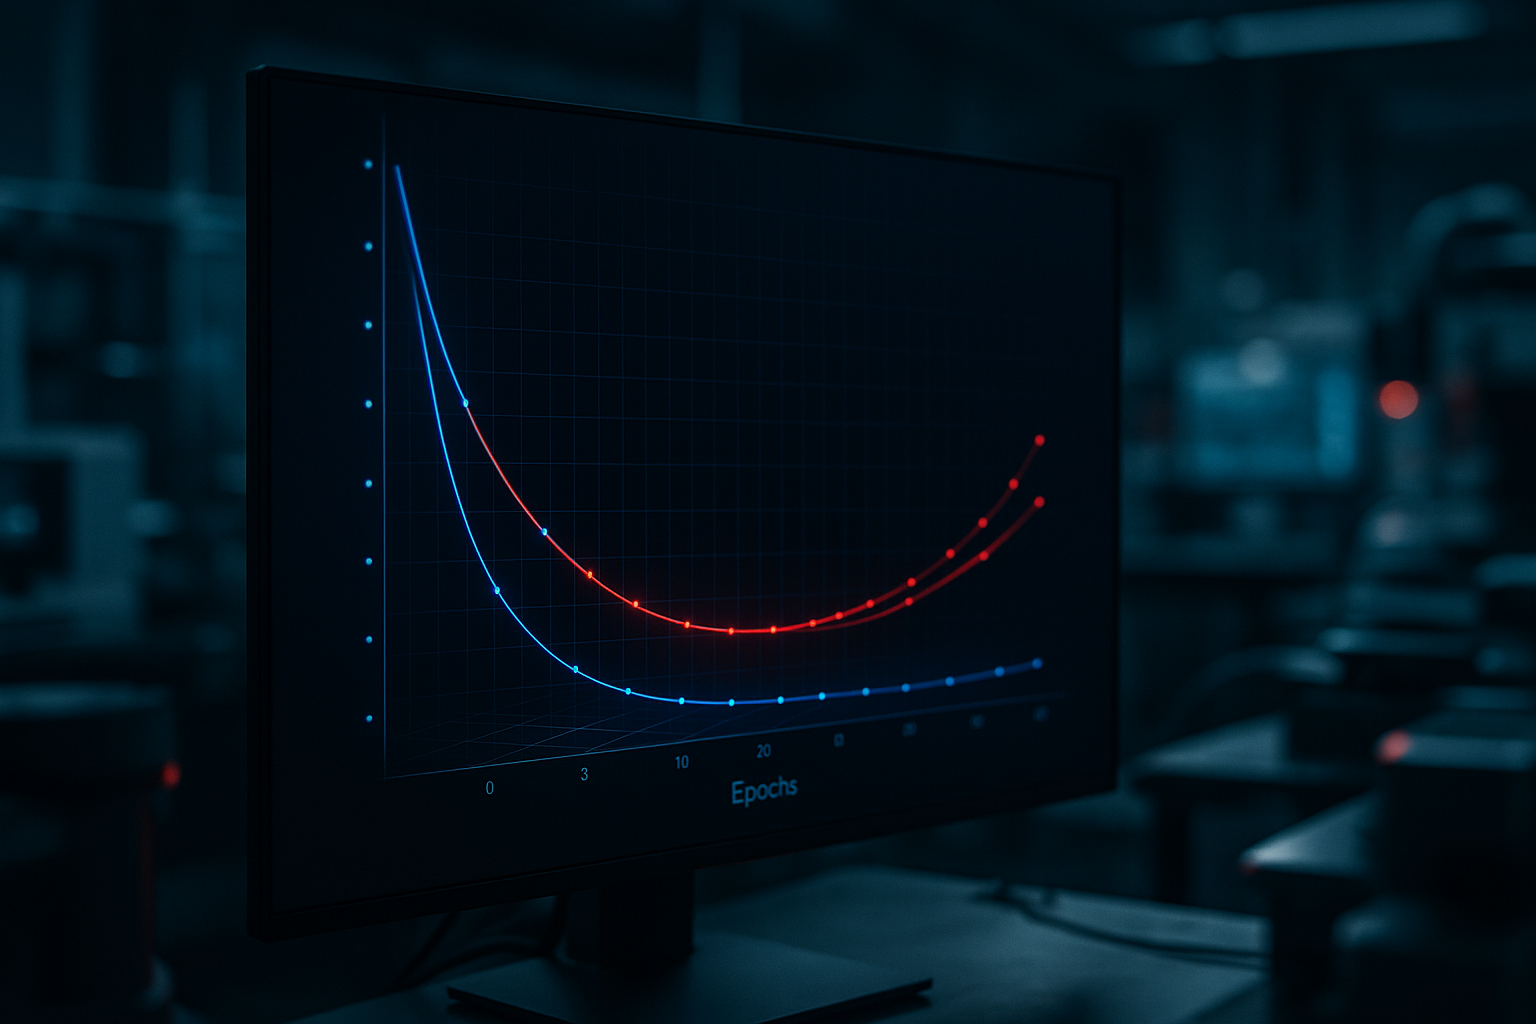
plt.show()This code snippet generates a simple loss vs epochs graph using sample data. The blue curve represents the training loss while the red curve represents the validation loss. These curves will be crucial in our subsequent analysis.
Step 2: Identifying Overfitting and Underfitting
Overfitting occurs when your model performs well on the training data but poorly on unseen data. This can be identified by a significant gap between training and validation loss, where the validation loss starts increasing while the training loss continues to decrease.
Underfitting, on the other hand, happens when the model performs poorly on both training and validation datasets, indicating that the model is too simple or lacks sufficient training.
To address these issues, consider implementing techniques such as regularization, dropout, or adjusting the complexity of your model. You may also need to gather more data or refine your data preprocessing techniques.

Step 3: Deciding When to Stop Training (Early Stopping)
Early stopping is a technique used to prevent overfitting by halting the training process once the validation loss stops improving. This is crucial for conserving computational resources and reducing training time. An optimal stopping point is when the validation loss plateaus or starts to increase.
Here's how to implement early stopping in TensorFlow:
from tensorflow.keras.callbacks import EarlyStopping

# Define early stopping callback
early_stopping = EarlyStopping(monitor='val_loss', patience=3, restore_best_weights=True)

# Train model with early stopping
model.fit(x_train, y_train, validation_data=(x_val, y_val), epochs=100, callbacks=[early_stopping])
This code snippet sets up an early stopping callback that monitors the validation loss and stops training if no improvement is observed after 3 epochs.
Step 4: Additional Inferences from Loss vs Epochs Graph
Beyond identifying overfitting, underfitting, and determining when to stop training, the loss vs epochs graph can also help you:
- Evaluate the learning rate: A steep drop in loss indicates a high learning rate, while a slow decline suggests a low learning rate.
- Assess model convergence: A well-converged model will show a gradual flattening of the loss curve.
- Compare different models or training strategies by overlaying multiple graphs and analyzing differences.
Common Errors/Troubleshooting
If you encounter errors or unexpected behavior while analyzing the loss vs epochs graph, consider the following troubleshooting tips:
- Ensure your data is properly preprocessed and normalized to avoid skewed results.
- Verify that the learning rate is appropriately set for your model and data. Try experimenting with different values.
- Check for data leakage, which can cause misleading validation results and affect model evaluation.
Frequently Asked Questions
How can I tell if my model is overfitting?
Overfitting is indicated by a divergence between training and validation loss, where validation loss increases while training loss decreases.
What is early stopping, and why is it important?
Early stopping halts training when validation loss stops improving, preventing overfitting and saving resources.
Can I use a loss vs epochs graph to adjust my learning rate?
Yes, the slope of the loss curve can indicate whether your learning rate is too high or too low.