To plot a line in python one just needs to use the Matplotlib’s pyplot library. We thus, need to first import Matplotlib. Also, a thing to note here is that the general standard convention is to import Matplotlib’s pyplot library as plt. If you do programming in Python you would generally be familiar with the plt alias. But, don’t worry I will take you through all the steps.
We also, might need to use the ‘ %matplotlib inline’ command after the importing and especially, if you are using the Jupyter Lab. It is a Jupyter notebook command which causes Matplotlib plots to also display directly inside the Jupyter notebook output cells.
We will also be using NumPy, a complex numerical calculations library for Python. NumPy is typically imported with the alias np.
###  Importing the pyplot method from the Matplotlib library
import matplotlib.pyplot as plt
import numpy as np

###  if using a Jupyter notebook, then, also include:
%matplotlib inline
NumPy library
The NumPy np.arange() function is used to create an array of numbers and also with different parameters like np.arange(start, stop, step). NumPy’s np.sin() and np.pi functions are used to calculate the sine of an array and compute the ‘pi’ values.
x = np.arange(0, 3 * np.pi, 0.1)
y = np.sin(x)
To create a line plot, one needs to give an as an argument to Matplotlib’s plt.plot() function. Then, finally the plt.show() command is used to display the plot that you have plotted.
# Displaying the Plot
plt.plot(x, y)
plt.show()

The result is a line plot that shows sin(x) from 0 to 3pi.
The various Characteristics of the Matplotlib Plot
One can thus, specify a variety of features on a Matplotlib plot. Lets see the various commonly defined features like Line Color, Line Width and also the other options :
Line Color, Line Width and other options
Thus, we can specify, the various options like the color, width, style of line in a Matplotlib plot. Line color, line width, and line style are also included as extra keyword arguments in the plt.plot() function call.
Thus, an example plt.plot() function call including line color, line width, and line style options is:
plt.plot(x, y, linewidth=5.0, linestyle='--', color='r', alpha=0.5, marker='*')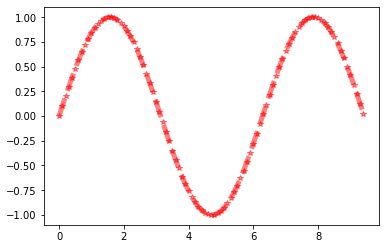
Below is a list of line widths :
linewidth=<float or int> | Line Width |
|---|---|
| 0.5 | 0.5 pixels |
| 1.5 | 1.5 pixels |
| 2 | 2 pixels |
| 2.5 | 2.5 pixels |
| 5 | 5 pixels |
Below is a list of line styles.
linestyle='<style abbreviation>' | Line Style |
|---|---|
'-' | solid line (default) |
'--' | dashed line |
'-.' | dash-dot line |
':' | dotted line |
'None' | no line |
Line Color
Colors can also be mentioned in the hexadecimal form like ‘ #FF89B4 ‘ or in RGBA (red, green, blue, opacity) format like (240,175,203,0.5).
Title
So, the plot title will be shown above the plot. Also, the plt.title() command accepts a string as an argument for the tile of the plot.
x-axis label
So, the x-axis label is shown below the x-axis. Also, the plt.xlabel() command accepts a string as an argument for the x-axis label.
y-axis label
So, as you know, the y-axis label is shown to the left of the y-axis. Also, the plt.ylabel() command also accepts a string as an argument for the y-axis label.
Legend
One can utilize the plt.legend() command to insert a legend on a plot. The plt.legend() generally accepts a strings as argument for the legend.
Grid
A grid can be added to a plot using the plt.grid() command.The only valid options for the grid are plt.grid(True) and plt.grid(False).
Basic Steps to Plot a Line in Python
The steps shown below offer a logical progression to develop a plot using Matplotlib :
- Importing the Matplotlib package.
- Then, do the defining of your data.
- Now, thus, plot the data using the various options
- Also, add the final plot details
- Finally, display the plot using the show() command.
Importing the Matplotlib package
Import the said library matplot.pyplot as plt, as well as the other modules you require to work with your data such as NumPy or Pandas.
Defining the data data
As, the plot needs to contain data. So, the data is defined after the imports. Also, typically, data for plots is contained in Python lists, NumPy arrays or Pandas dataframes.
Plotting of the data using various options
One needs to use the plt.plot() command before the other plot details are specified. You can then use the various options and keywords in the plotting option.
Adding Final Plot details
Then, after the plt.plot() line, one needs to add details such as the title, legend, the axis labels, the grid and tick labels.
Displaying the Plot
Thus, to finally display/show your plot, one needs to use the plt.show() command. The plt.show() command also causes the plot to be displayed in the python file. Thus, a point to look out for here is, that the plt.show() needs to be called only after the plt.plot() function.
# Importing the Matplotlib package
import numpy as np
import matplotlib.pyplot as plt
%matplotlib inline
# Definition of the data
x = np.arange(0, 4 * np.pi, 0.2)
y = np.sin(x)
# Plotting the data using the various options
plt.plot(x, y, linewidth=0.5,linestyle='--', color='r', marker='o',
markersize=10, markerfacecolor=(1, 0, 0, 0.1))
# Adding the Final Plot details
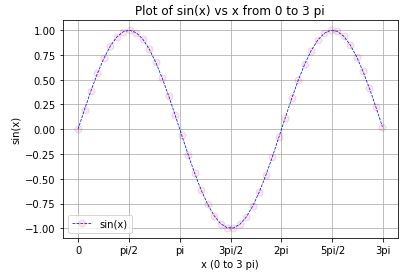
plt.title('Plot of sin(x) vs x from 0 to 4 pi')
plt.xlabel('x (0 to 4 pi)')
plt.ylabel('sin(x)')
plt.legend(['sin(x)']) # list containing one string
plt.xticks(np.arange(0, 4*np.pi + np.pi/2, np.pi/2),
['0','pi/2','pi','3pi/2','2pi','5pi/2','3pi','7pi/2','4pi'])
plt.grid(True)
# Lastly, display your plot
plt.show()
++ SUMMING UP ++ –> Plot a Line in Python
So, we now know that to plot a line in python one just needs to use the Matplotlib’s pyplot library. We, thus, need to first import Matplotlib. Also, a thing to note here is that the general standard convention is to import Matplotlib’s pyplot as plt.
Thus, through this article, you would have got an idea as to the general steps to follow to plot a line in python. By and through this article, thus, I suppose I have made myself pretty clear. But, in case, you still have some doubts lingering. Then, please do write to me in the comments section and I am as always, ever-ready to help you. And, also solve your many queries and problems.
Until then bidding you Good-Bye !!! Ok, wait ….. before you go, you may check out my various other posts. Also, for the simple reason, that is, to enhance your knowledge on various other topics of importance. Also, where ??? Here……