
Hello folks, today we will be looking into the quantile function in R programming. A quantile is nothing but a sample that is divided into equal parts. It returns the 5 point fractiles of the input data. In which, 25% is the lowest and 75% is the highest quartile.
Syntax of quantile function in R
Quantile: The quantile function in R is used to get the distribution of the given data at particular percentiles.
quantile(x, probs, na.rm = F)
Here,
X = Input data.
Probs = The probability values (between 0 and 1).
na.rm = remove na values (by default it is False)
Simple Quantile function in R
So, we are good with syntax and let’s apply the quantile function to the given data and let’s see how it works.
df <- c(12,32,34,54,67,87,56,78,89)
quantile(df)
  0%  25%  50%  75% 100%
  12   34   56   78   89
Well, we got our answers. The quantile function returned 25%, 50%, and 75% of the data. 0% and 100% are the min and max values respectively.
Quantile function with Probabilities
You can use the probs argument which is present in the syntax to get the specific percentiles of the given data. It means if you want to know the 30% or 65% of the data, you can use this parameter.
df <- c(12,32,34,54,67,87,56,78,89)
quantile(df, probs = c(30,65))
Error in quantile.default(df, probs = c(30, 65)) : 'probs' outside [0,1]Oh, No.
We got an error. What happened?
Well, as I said earlier, the probs value should be between 0 and 1. So consider adding .30 and .65 to negate the errors.
df <- c(12,32,34,54,67,87,56,78,89)
quantile(df, probs = c(.30,.65))
30%     65%
42.0    69.2
Quantile using the na.rm argument
What you will do if the data has NA values in it. All you need to do is to use the na.rm argument. Let’s see how it works.
df <- c(12,32,NA,34,54,67,87,NA,56,78,89,NA,NA)
quantile(df,na.rm = T)
0%  25%  50%  75% 100%
12   34   56   78   89
The na.rm parameter is used to remove the NA values present in the data. Because the quantile function only takes the numerical values as input. Otherwise, it will throw an error.
Visualise what you found!
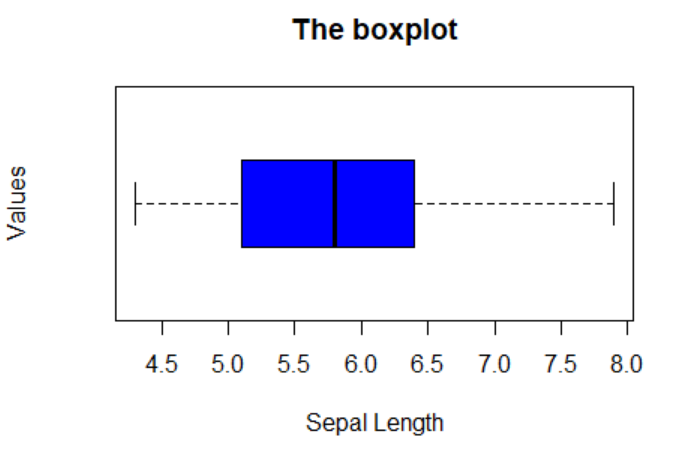
Till now, with the help of the quantile function, we got the percentile values of the data. Now it’s time to visualize our findings using box plots.
boxplot(iris$Sepal.Length,main='The boxplot',col='Blue',ylab='Values',xlab='Sepal Length',border = 'Black',horizontal = T)
Wrapping Up
The quantile function in R is used to get the percentile values of the input data. You can also make use of arguments such as probs and na.rm to deal with specific percentiles and NA values respectively. That’s all for now. Happy R!!!
Read: R docs